
Regardless of the audience, security must focus on telling a story. Metrics and key performance indicators (KPIs) play an increasingly important role in the narratives that drive the design, deployment, and operation of efficient, reliable, and robust networks. This piece offers a step-by-step process for creating network-focused performance metrics and KPIs that resonate with executive leadership.
How to Establish Network Performance Metrics
The following process can be used as a general guide to create effective network performance metrics and KPIs that support your organization’s specific goals and story.
1. Get Program Resources in Place
It’s difficult for an organization to successfully implement effective network performance metrics and KPIs without dedicated and qualified resources. A network performance program needs people that understand data analysis, network/security engineering and data science. Look to your network and security teams and select based on experience and interest. Also, incident response resources generally have some of the data analysis and engineering experience required.
Additionally, business intelligence (BI) tools are important when dealing with large and varied datasets. Examples include, but are not limited to toolsets like Microsoft Power BI and Tableau. Alternatively, Advizor Solutions provides a minimal BI tool that is useful for simple and fast iteration on small datasets.
2. Get the Data
Begin with the data and metrics you already have. This is known as “reverse-modeling” and has the advantage of providing quick access to potential network performance metrics and KPIs for your goal and story arc development. The downside is your existing data fidelity directly impacts your situational awareness as well as the caliber of your goals and story.
Focus on gathering and storing accurate and complete data in an efficient and cost-effective way. Also, consider prioritizing the implementation of a centralized event data repository (e.g., a SIEM like Splunk), where network and security telemetry are stored (if it does not already exist).
3. Choose the Metrics
Select metrics from the data that are meaningful and lend themselves to the development of your goal and story arc. As you consider and prioritize your metrics, consider the following characteristics:
- Accuracy: Are there errors you cannot account for?
- Validity: Can you verify the data is correct?
- Feasibility: Can the data be collected in a consistent and timely manner?
- Robustness: Is the data accuracy and validity consistent?
- Efficiency: Does collecting the data cause problems?
- Desirability: Is the data useful for building metrics that further your goal and story?
4. Define Your Goal and Draft Your Story Arc
Your story should be aligned with your goal and supported by the situational awareness that comes from your data and metrics. Other factors, including goals and expectations set by your organization’s leadership, external factors and circumstances outside your control should also be included. When formulating your goal and story, consider the following questions:
- Do you have the right architecture, equipment, and implementation?
- Do you have enough of the right resources?
- Is something broken?
- Has there been a security incident?
- Are your customers, clients, and users happy with the network?
5. Define the KPIs
KPIs start with one of more metrics, followed by the current state and ending with the goal state. As you compose your KPIs, keep your audience in mind. What individual audience members want, need, or expect from a network performance metrics and KPI
presentation varies greatly, but in general, executives likely want to know the answers to the following:
- What do things cost? KPIs that focus on the cost to procure, maintain, and operate the network, along with energy and power metrics like total energy consumed and embodied energy can address this.
- Are customers, clients, and users happy? Quality-of-experience (QoE) KPIs can be used to measure end-user experiences and perceptions. They are typically subjective, making them time-consuming and laborious to collect. Mean opinion score (MOS) is a common measurement and can be applied against video and audio application experiences. More objective assessments of QoE can be derived from quality-of-service (QoS) KPIs. The Application Performance Index (APDEX) offers a more advanced objective assessment alternative.
- How well is the network running? QoS KPIs can be based on both application and network performance metrics, although starting with the network is a practical approach. Performance KPIs should include transmission time, throughput, link throughput, packet delivery ratios, average end-to-end delay, and total network throughput metrics. Availability KPIs should focus on mean time to failure (MTTF), mean time to repair (MTTR), mean time between failures (MTBF) and average uptime availability.
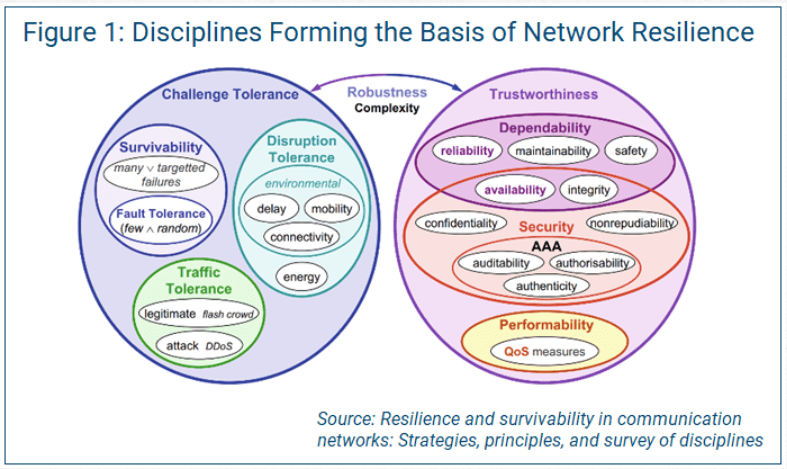
- Is the network secure, reliable, and resilient? Security KPIs should focus on what is attached to the network and whether devices are controlled, owned or unknown. For controlled and owned devices, KPIs describing compliance with firmware, software and
configuration baselines can provide insights into how effectively the network is managed and how susceptible it is to adversaries. Measuring network reliability and resilience is one of the more complex sets of potential KPIs. Figure 1 below summarizes
the many disciplines that serve as the basis of network resilience. Measuring node connectivity, or the smallest number of node-distinct paths between any two nodes and the smallest number of nodes whose removal will disconnect the network, along with elasticity can provide meaningful resilience and robustness KPIs.
6. Enhance with Additional Measurements
Once you have a better understanding of your existing metrics and have clarity about your goal and how you want to communicate your story, you can consider enhancing your existing metrics with additional measurements. This is known as “forward-modeling,”
and relies on insights about your requirements and needs to drive the selection of measurements.
Network Performance Metrics Mistakes & Pitfalls
Metrics and KPIs are almost infinitely varied in options, combinations, views, and the stories they tell. That said, some common mistakes and pitfalls to try and avoid when building a network performance metrics dashboard include:
- Inaccurate metrics: Nothing spoils a presentation faster than having someone point out erroneous, conflicting, or nonsensical metrics.
- Signal-to-noise ratio: The signal in a metric is what supports your story. If the signal is difficult or impossible to spot in the metric, you are not helping the narrative. Focus on selecting metrics with good signal-to-noise ratios. For example, instead of reporting every SSH brute force attack against a server (which is noisy), consider reporting only those that use valid usernames and passwords (i.e., the data that matters).
- Context matters: This is true for all interactions between people; stories, metrics and KPIs are no exception. Even the most amazing metric on paper loses its utility in the absence of context.
- Define (and stick with) your parameters: When presenting metrics, clearly label X and Y, and be consistent. If X is time on your first metric, keep it that way throughout your story. Also, avoid non-linear scales for parameters because they can confuse and possibly mislead your audience.
- Snapshots in time: Metrics that show a snapshot in time do not provide sufficient context. Histograms that include time as a parameter and convey trends are almost always the best way to tell a story.
- Enumerating badness: This pitfall can be the easiest to fall into because it is very common with both network and cybersecurity metrics. Beware a situation such as a graph of the total volume of network traffic or attacks over time where none have ever provided any meaningful insights.
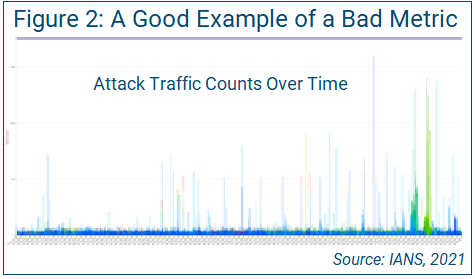
Figure 2 shows a nice, colorful metric with a signal-to-noise ratio approaching zero and no meaningful context. It begs the questions, “Is this good or bad?” and “Is there anything in this metric that we care about?”
Test each of your metrics, views, and trends with these three simple questions:
- Does this metric support my story?
- What does the metric mean?
- Why does the audience care?
If you cannot clearly and concisely answer these three questions, then it is not the right metric, view, or trend.
Network Performance Metrics for Leadership
To improve your chances of success with your network performance metrics when reporting to IT leadership of executive leadership, consider the following tips:
- Stand up resources for your metrics program: This includes people, tools, and infrastructure.
- Define your goal and the story you want to tell: This is the most important step.
- Develop meaningful metrics and KPIs that support your story: Use existing data and metrics to start.
- Add additional measurements to improve your story: Consider metrics and KPIs that help drive continuous improvement.
Although reasonable efforts will be made to ensure the completeness and accuracy of the information contained in our blog posts, no liability can be accepted by IANS or our Faculty members for the results of any actions taken by individuals or firms in connection with such information, opinions, or advice.