
Whether you are a new CISO starting out at a new organization or a tenured CISO coming under more scrutiny from executive leadership, a centralized metrics dashboard will help track goals and trends and satisfy multiple stakeholders within your organization. In this piece, we outline the basic metrics CISOs should consider for their dashboards.
CISO Dashboard Stakeholders
At the highest level, CISO dashboards typically have two types of consumers: Those who need tactical data and those who need strategic status.
Using the top metrics would be an example of satisfying stakeholders with tactical concerns, while strategic use cases would satisfy stakeholders with governance concerns. They should expect to see key risk indicators (KRIs) in conjunction with whatever framework you may be using, be it the NIST Cybersecurity Framework (CSF), ISO etc.
A logical combination of each is the ideal but consider starting with the tactical metrics. The idea is to design a dashboard with the flexibility to add as many key tactical metrics as needed based on business and risk drivers.
GET STARTED: CISO Compensation & Budget Benchmark Survey
5 Key Metrics for a CISO Dashboard
The first step is to outline “metric primitives” you can use to compose metrics you care about, given your business and risk drivers.
There are five main metrics areas to consider, each requiring progressively more sophistication:
- Coverage: Most organizations focus on breadth only at the early stages of maturation, but depth should also be considered. For example:
- Breadth: Our vulnerability management program covers 80 percent of data center and cloud deployed assets. We are targeting 100 percent by the end of the year.
- Depth: Our program covers 60 percent of our crown jewel’s compute stack. We will hit 85 percent by year’s end. Our stack includes business logic, data at rest/motion/use, container security, host security, etc.
- Remediation (backlog) efficiency: This is sometimes called “remediation” or “mitigation” management. Here is an example of how the backlog works:
- In January, you accumulate 100 high-priority remediation items, and in the same month you also resolve 50 items. In February, you add 100 more and resolve 50 more. The same happens in March.
- The cumulative backlog management rate of closed vs. open is 150/300 = 50 percent.
- You can then turn this into a metric: We are currently running at a 50 percent remediation effectiveness rate for high-priority crown jewel risks. We are targeting a 75 percent effectiveness rate by year’s end.
- Risk exposure rate: This also is a simple ratio. It measures the rate at which new risk is exposed. A simple example could be first-party vulnerabilities, i.e., software vulnerabilities your team releases into production. Here is
an example of how this works:
- In January, a new product is released into production. Prior to that release, there were 50 critical vulnerabilities discovered and remediated in pre-production. Sometime later, five more vulnerabilities were found in production.
- In February there was another release. Prior to that release, there were 25 vulnerabilities discovered and remediated in pre-production. Sometime later, two more were found in production that may be attributable to either release.
- In March, we have the same scenario, in this case its 25 and five, respectively.
- That is 12 vulnerabilities that were exposed, and 100 that were not. The total number of vulnerabilities is 112. To get the average in this case, we put exposed over total or 12/112, and it rounds up to 11 percent. (Please note: There are more sophisticated models for this that include how certain we should be about that 11 percent, given the amount of data we have, but that discussion is beyond this scope.)
- This is just one example, however, the focus is on looking for as many risk exposures examples as possible, such as in the more general area of vulnerability management, malware defense, etc.
- Time to event: Many treat this as measuring if a service-level agreement (SLA) was met or not, and this certainly is a viable measure. However, your security team should also consider the following for both threats and vulnerabilities
as follows:
- Time to discover: How long did it take to discover a threat or vulnerability?
- Time to contain: How long did it take to contain or mitigate the threat or vulnerability?
- Time to eliminate: How long did it take to remediate and or remove the threat or vulnerability?
- Total time to address: This is the sum of the first three.
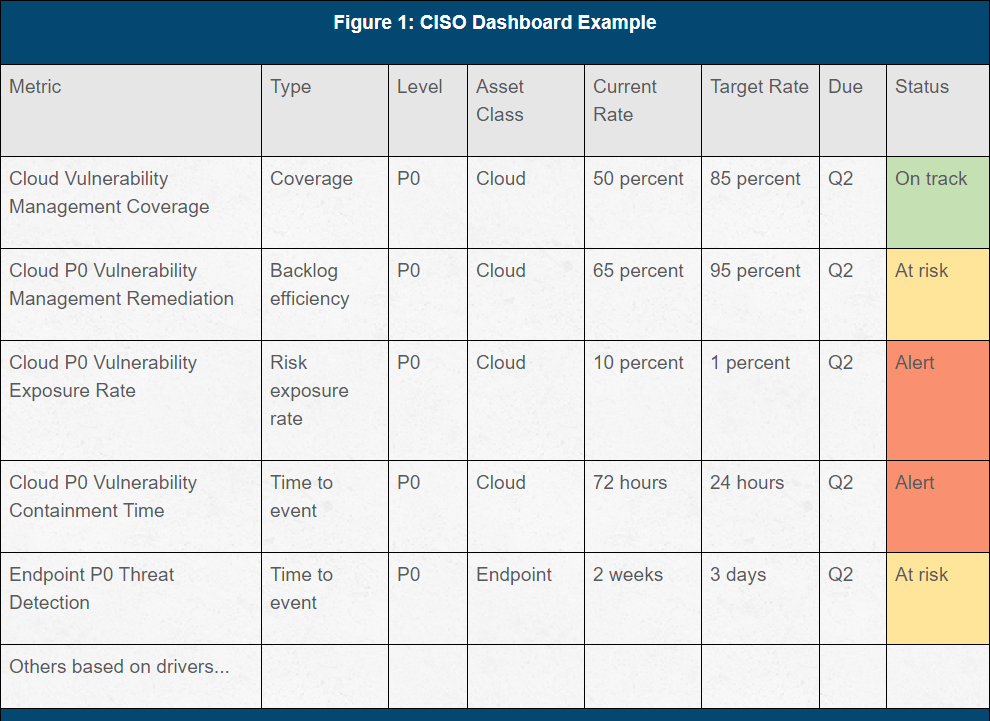
- Metrics composition: Metrics combine one of the four elements above with a priority level (P0, P1, P2, etc.), asset class, current rate, target rate, due date and a status. This provides an opportunity to easily create numerous metrics and then pick the ones most critical to your business. This approach should also allow you to convert metrics into forms of objectives and key results (OKRs).
READ MORE: Create an Actionable CISO Dashboard: Build Meaningful Metrics
CISO Dashboard Example
Other Related Resources
- How to prevent and detect packet sniffing attacks
- The CISO pay gap: Inside cybersecurity's massive compensation divide
- Use NIST to secure baseline configurations and mitigate risk
- How to transition to an IT shared services model
- 2024 Security Budget Benchmark Report- key findings
- How do you compare? 2025 Comp and budget data for small and midmarket CISOs
- Healthcare security comp & budgets decline: Access key report data and trends
- GRC trends for 2025: Building resilient programs for the future
- Who should the CISO report to
- Industrial Control System (ICS) risk mitigation checklist
- Key financial services security budget impacts in 2025
- Build CISO strategic impact and visibility: State of the CISO 2025 is live!
- How to establish an effective Data Governance Committee
- Best practices for secure and effective third party POC's
- Benchmark Report Preview: The BISO role in numbers
- Key drivers of CISO compensation
- Prioritize security projects for leadership: build a risk impact matrix
- What are the top security budget spend priorities?
- CISO's face tough challenges as budgets tighten: trends in security software spend
- How to streamline vendor selection
Although reasonable efforts will be made to ensure the completeness and accuracy of the information contained in our blog posts, no liability can be accepted by IANS or our Faculty members for the results of any actions taken by individuals or firms in connection with such information, opinions, or advice.