
Create an Actionable CISO Dashboard: Build Meaningful Metrics
CISO metrics are composed of a measure, trend and goal. These metrics support one of the three C’s: coverage, configuration and capability effectiveness. This piece provides guidance for using these principles to create meaningful metrics to populate a CISO dashboard.
What Is a Security Metric?
For many metrics, the problem is with their definition. Once what a metric is and how those metrics are built are defined, at least half the problems with creating those metrics vanish. The first challenge to overcome is to know what a metric isn’t. A metric is not a count at a single point in time. For example, “We have 20 critical vulnerabilities, 100 vulnerabilities of high importance, etc.” While counts of things play a part of metrics, there is much more to the story.
A Measure, a Trend and a Risk-Based Goal
A measure is more than a single number or count. Nine times out of 10 it is a ratio or rate. There are five types of measures for security:
- Burndown rates: The rate at which security risks are removed.
- Survival rates: The time to live, identify, respond, recover, etc.
- Arrival rates: The speed at which security risk events arrive.
- Wait time rates: The time between security risks.
- Escape rates: The rate at which risk escalates to a lesser state of control, for example, moving from internal to external.
Consider starting with the first two of the five measures above.
Burndown rates measure the rate at which risk is removed. This is a cumulative rate. For example, in December, you discover 100 critical (remotely exploitable) vulnerabilities. In that same month you fix 50 of those vulnerabilities. That is a 50% burndown rate. In February, you find an additional 100 vulnerabilities. Of the total remaining, you fix 30. That is 80 out of 100, or a 40% burndown rate. Over time, as you accumulate data, the rate baselines. Baselining means the rate is stable and more accurately reflects the underlying process it measures.
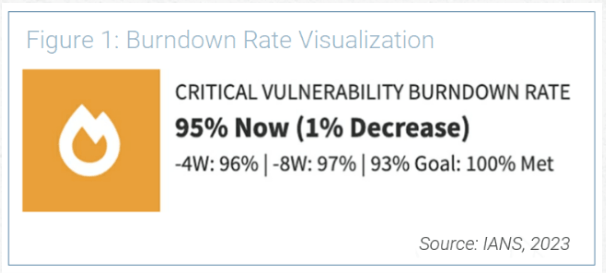
A baselined rate allows you to measure changes in trends over time. For example, the burndown over the last quarter may have baselined at 70%. Perhaps that is a 5% change from last month (75%). If your goal is 95%, your metrics would be at risk. Figure 1 offers an example of what this might look like.
The 3 C’s of Security Metrics: Coverage, Configuration and Capability
Most metrics evolve to address two of the three C’s: solutions coverage and configuration of that solution. This is exactly where the Center for Internet Security (CIS) metrics focuses. CIS offers the sigma levels displayed in Figure 2 (for those unfamiliar with sigma levels, they are a way of measuring the quality of a process or product).
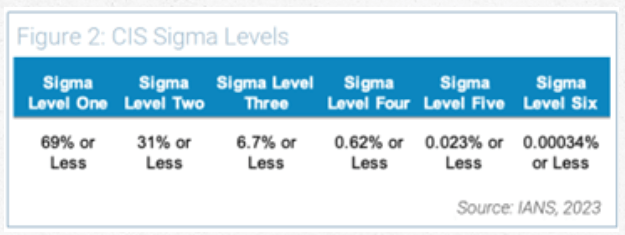
Imagine these levels applied to the question: What percentage of the organization's networks have not recently been scanned by an active asset discovery tool?
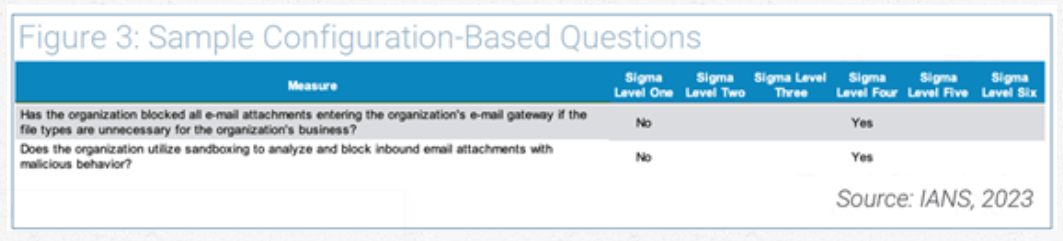
The second C, configuration, is a simple yes or no answer to a question. Figure 3 provides an example of how the CIS V7 metrics address configuration-based questions:
The most mature and most important metrics are capability-based. The burndown metric is a perfect example of this. It measures how efficient you are in meeting risk-based goals over time.
How to build CISO Dashboard Metrics
Nearly all CISO metrics should be capability-based. But which capabilities matter most? This is determined by looking at the most plausible threats and losses your business faces. Start with key losses, which can generally be broken down into a minimum of classes:
- Data breach
- Business disruption
- Extortion
- Wire fraud
You may have other loss types critical to your business depending on your individual organization’s needs and experiences. Next, map losses to the threats you focus on. A list of top-of-mind threats includes but is not limited to:
- Ransomware
- Business email compromise
- Third-party cloud compromise
- SaaS compromise
- Insider threats
Based on your analysis, you will have threat and loss combinations that represent the largest areas of risk. At this stage, you can “t-shirt size” (project manage and capacity plan for) the combinations that matter most. Figure 4 demonstrates an example of t-shirt sized risk relations:
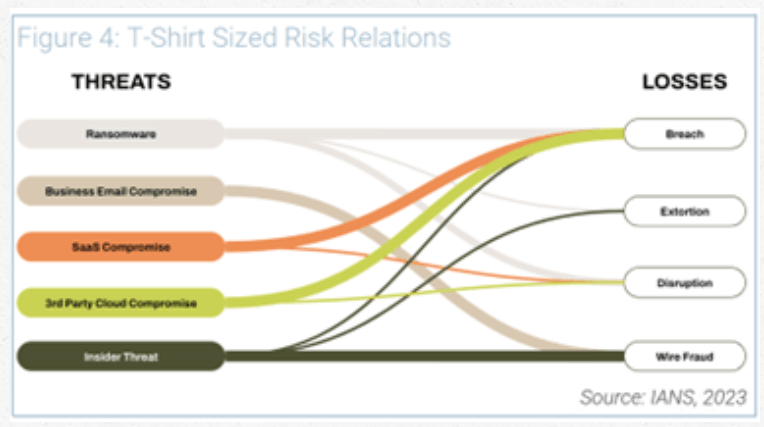
Looking at this visualization, but without going into quantitative analysis, it’s clear that breach and wire fraud are the outsized losses for this example business. In this case, the business will want to have strategies to address those losses.
Ideally, you will want to invest in controls that offer value across multiple threat use cases. For example, you may decide that stronger IAM controls are needed to limit access to data (to prevent breaches) and purchasing systems (to combat wire fraud). While you may implement a longer term zero trust strategy, two controls related to zero trust are worth immediate consideration: MFA and PAM.
Further, these are examples of capability-based metrics that could be applied to the PAM side:
- Privileged account burndown rate
- Arrival rate of privileged account sessions without corresponding tickets
- Unowned privileged account burndown rate
- These will need to be baselined before you set goals.
Risk Strategy Drives Metrics
It’s tempting to say, “Why can’t someone just give me a list with a ready-made set of metrics?” However, metrics in this case must be derived from your risks.
- Identify your threat and loss combinations.
- Identify the most efficient controls to address your risks.
- Based on those controls, define metrics that will quantifiably demonstrate if you are reducing risk.
- When in doubt, start by looking at your losses.
DOWNLOAD: Create Incident Response Metrics Worth Reporting
It is hard work, but it can be rewarding. Following this process, you will find metrics that truly matter to the material risks your business faces.
Although reasonable efforts will be made to ensure the completeness and accuracy of the information contained in our blog posts, no liability can be accepted by IANS or our Faculty members for the results of any actions taken by individuals or firms in connection with such information, opinions, or advice.