
Create Security Metrics That Connect Back to the Business
For CISOs, security leaders and their teams, security metrics can be a challenge. Determining what metrics to track and developing a process for implementation is complex. Most other departments or functions within an organization have standard metrics that clearly indicate they are on track to meet pre-defined, and typically, universally understood objectives. Unfortunately, it’s not as straightforward for security teams, and even more challenging when trying to connect and present metrics to the business.
This piece details three financially focused metrics that can be used to explain the importance of security (and its funding) to executives and the board.
Business Security Metrics: The Problem
Business leaders think in business terms. That means they think in dollars, which are mathematically unambiguous. Business leaders also understand risk as opportunity gain or loss. “Opportunity” is the chance of something impactful happening by a certain time. The goal is predictability of business opportunities.
This puts security in a difficult position, particularly when in front of a board. Security leaders don’t usually speak in dollars beyond spending them. And they rarely, if ever, use forecasts. Security speaks in scores and counts. Boards and financially oriented executives have trouble translating those values to business metrics.
To bridge this gap, security has turned to semi-quantitative tools like heat maps. Most boards passively accept these (with little interest), but they often ask for more data. For security leaders to get engagement from board members and executive teams, their metrics must align with what those leaders know. And that means speaking in financial terms and dropping vague scores and heatmaps.
READ: Reporting on Information Security Metrics That Matter to Executive Leadership
Connecting Security Metrics to the Business
To develop business rapport, security must demonstrate two things: how security helps with business opportunities and how security reduces future financial loss. The former enables revenue, while the latter protects revenue.
Enabling Revenue
Security that enables revenue is security the business understands. For example, a portion of sales hinges on meeting customer security requirements. This impacts companies that sell to midsize businesses and larger. Counting up your security-dependent deals, along with their revenue sizes and losses is a good place to start. The good news is that most companies have security requirements. These requirements come in the form of a security checklist. The security capabilities you have invested in allow checklists to be filled out so sales can go forward.

Figure 1 provides an example of the raw data on security-dependent deals to track as a start.
The data above gives a very rough idea that security operations matter in overall revenue generation. There were 210 security deals with questionnaires, of which 10 failed to meet requirements. Those 10 deals were a small share of lost revenue, equaling 2.5% or $1.5 million.
For example, if the operational cost to meet those sales requirements was $2 million. The return on investment (ROI) is 75% ($1.5 million divided by $2 million). If sales forecasts a growth in these types of sales to be about $6 million, then you have a four times ROI (400%). Now there is a revenue-based rationale for expanding your budget. This is a rough way of sharing upside (revenue-generating) value.
The next example is more aligned with standard financial metrics. It’s one of many to consider making with your finance team.
Calculating Security Scale
How well are security operations generally helping the business? To better answer that question, we can turn to a standard financial metric called the return on net operating assets (RNOA). This is a metric that chief financial officers (CFOs) and other financially oriented executives will understand.
The RNOA represents efficiency in generating income. The objective is to show security’s portion of the RNOA (security RNOA). And more importantly, illustrate how security is scaling efficiently with the business in a way finance execs will understand.
To calculate your security RNOA use a simple ratio to benchmark security’s operating capital efficiency as it relates to revenue generation.
To determine if security is scaling financially, request some information from your CFO’s team which will help them understand the value your security program brings to the business beyond pure loss management. Your question for them is: What is the return on net operating assets?
This is the formula: RNOA = Net Income After Taxes / Net Operating Assets
To break each step down for security reporting keep in mind the finance team will have the RNOA. Your job is to show the share of security’s operating budget in generating business ROI. These first numbers come from Finance:
- Net operating assets (NOA) = $50 million
- Net income after taxes (NIAT) = $15 million
- RNOA = NIAT / NOA
- RNOA = 30%
The RNOA above is a conservative ROI. The business knows what RNOA works. It’s often a function of benchmarking across businesses. For your industry and current state of the business, a 30% RNOA may be just right. Your CFO will know which figures to provide.
To calculate security’s share of NOA for this example, let’s assume security’s net operating budget is $3 million. It’s a small chunk of the overall $50 million NOA, and it turns out to be 6% (in the calculations below).
- Security NOA (SNOA) = $3 million
- Security NOA Ratio (SNOAR) = SNOA/NOA
- SNOAR = 6%
The question now is whether a 6% share of the operating budget is good. If the CFO says the RNOA is within tolerance, this is part of the answer. In short, operations “in general” are efficient.
Security should aim for scaled efficiency. That means the 6% rate holds or decreases as the RNOA increases. For example, let’s say NIAT grows to $25 million and NOA grows to $55 million. That equates to a 45% RNOA. If security budgets did not change, that becomes a 5% SNOAR. If security budgets increased by an additional $500,000, then there is still a 6% ratio. In summary, your security program’s use of capital is “relatively” efficient and characterized as scaling as operations generate more revenue, which is a valid metric.
Defining a Key Risk Indicator
Security dollars are used to reduce the likelihood and impact of financial losses caused by a breach, fraud, extortion and more. Risk management can’t be sacrificed for operational asset efficiency. Ideally, both opportunity and loss management work together.
The main business-based loss metric is “the likelihood of exceeding risk tolerance.” Risk tolerance is a financial number. Most often, it is the limit on the cyber insurance policy. The limit is how much money the policy will pay out if there is an event like a breach. Any costs incurred above organizational limits come directly out of pocket, and part of that money could have been used in operations to generate revenue. Security’s goal is to reduce the likelihood of that happening.
Imagine your organization’s insurance limit is $3 million and the chance of exceeding that limit over the next three years is just over 30%. Let’s assume you are not comfortable with that figure and want to achieve a 10% chance of exceedance. Figure 2 below shows what that might look like.
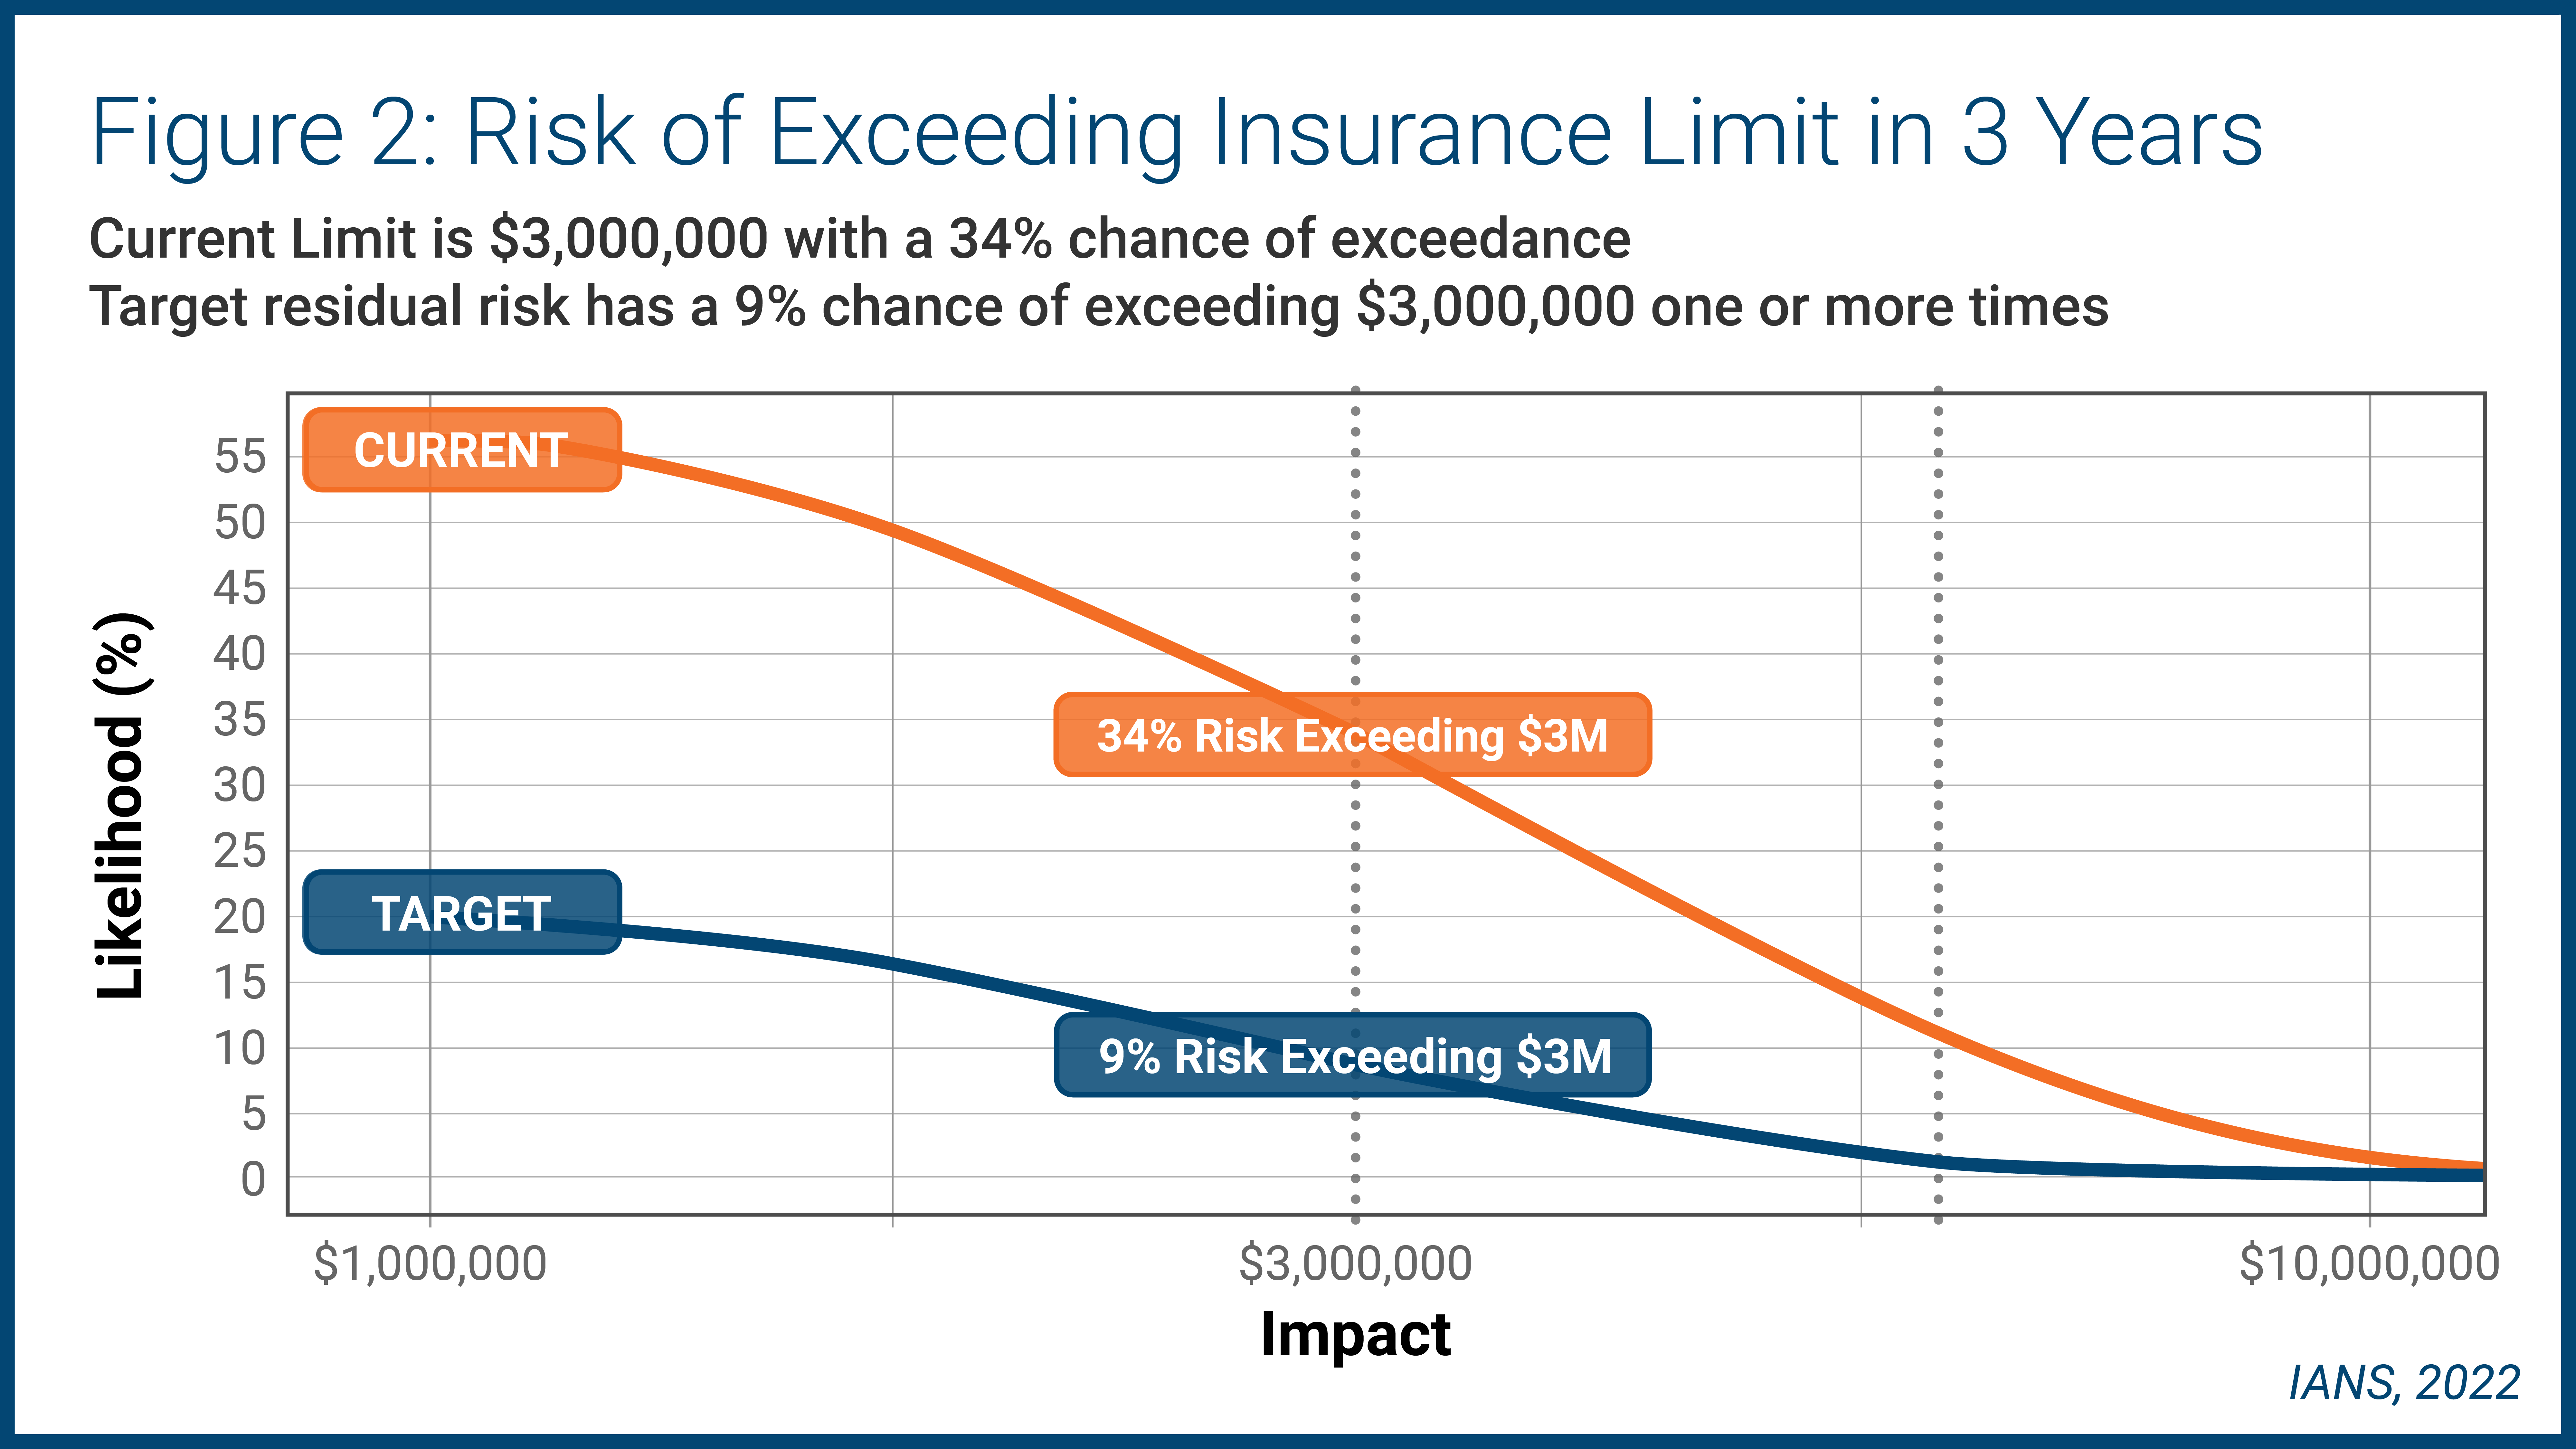
There a 34% chance of exceeding your risk tolerance with a 9% target key risk indicator (KRI). If your program has a 6% SNOAR with a 33% chance of exceeding tolerance, it is advisable to allocate more money to get your operational risk within tolerance.
Why is this another conversation to have with your CFO? Your CFO’s team likely purchased your organization’s security insurance because it has an idea what the tolerance is. The CFO (and other team members, such as the CIO, general counsel, etc.) need to align with your security program’s goals.
One option is increasing your limit. The second gray dotted line to the right above in Figure 2 gauges the limit at $6 million. However, the challenge is that buying more insurance is often predicated on having adequate security capabilities—a double-edged sword.
READ: Key Server and Endpoint Security Metrics to Track
Creating the Right Information Security Metrics
Creating metrics that resonate with the business doesn’t have to be overly difficult. To be successful, security teams must:
- Focus on the financial aspects of security, including enabling revenue and reducing loss. Consider using three levels of metrics for the C-suite that show how security enables revenue, scales with the business and quantifies risk.
- Use the three measures to have meaningful conversations with your CFO, board and other executive team members.
- Consider undergirding these metrics with security operational metrics
Although reasonable efforts will be made to ensure the completeness and accuracy of the information contained in our blog posts, no liability can be accepted by IANS or our Faculty members for the results of any actions taken by individuals or firms in connection with such information, opinions, or advice.