
How to Develop a More Holistic Risk Management Program
A Strategic Guide to Maturing Your Risk Management Function
A more-holistic risk management program that examines risk from cradle to grave adds a quantitative approach to its qualitative one. More mature programs will add classification of assets, rating assets by importance. This allows correlation between high-risk and high-value assets. The current state-of-the-art approach is cyber risk qualification (CRQ), which is decision analysis applied to cybersecurity risk management. This piece explains that to create a more holistic risk management program, an organization needs to introduce more-continuous visibility into assets and grow into assessing value at risk.
Current State of Risk Management Examples
Qualitative vs. Quantitative Risk Approaches
If an organization’s current cybersecurity risk management program in place is purely qualitative in nature then the impact is not understood financially, nor are probabilities used to determine likelihood. The rationale is that the team is able to assess more risk with qualitative approaches.
If the current program remains largely qualitative, there is openness to introducing more quantification. In light of that, the goal here will be qualitative with the intent of setting the stage for future quantification.
Development vs. Production Risk Programs
If a current risk management program is in pre-deployment only, this means its focus is on:
- First-party software development
- Technology acquisition
- Systems configuration
The goal is to move into a more-holistic form of risk management: cradle to grave. This will require continuous “visibility” in terms of asset hygiene and growing into assessing value at risk. Value at risk represents a range of possible losses caused by security compromise of data, availability and direct financial impacts from wire fraud and/or extortion. We can approximate the financial value at risk by focusing on standard assets.
Current Risk Management Program Focus
Asset-and Assessment-Focused
Most risk management programs are based on technical assessments of cybersecurity assets. Upward of 90% focus their solutions on vulnerability and configuration management. More-sophisticated companies marry those assessments to some concept of asset class.
An asset class could include concepts such as:
- Externally facing
- Cloud-hosted
- Data center-hosted
- Cloud-native (container, app, etc.)
- Virtual machine
- Managed endpoint
- Network equipment
These asset distinctions can then be assembled as such:
- Externally facing data center
- Externally facing third-party cloud
Assets are given a qualitative rating as to their importance. Many organizations will use a scale of 1 to 5 or some other form of graduated scale. These are formally called ordinal scales. An ordinal scale is an ordered list and does not need to always use numbers—and often doesn’t. For example, the CVSS is an ordinal scale; although, it uses decimal values between 1–10. It’s simply a rank order approach.
Vulnerabilities are correlated to assets. The highest risk vulnerabilities that are paired with the highest risk assets get priority.
Heatmaps and Risk Registers
From an enterprise risk management perspective, you will see heatmaps and/or risk registers as the main means of aggregating and communicating risk. Most heatmaps are five by five. (Most risk registers are simply list-based heatmaps.) One axis of a heatmap holds asset risk and the other is security risk. Other terms could be applied like impact and such. Anything in the upper right-hand corner that is considered a five on each axis gets the most attention. You may find you have 25 things in the five-by-five box and 40 in the five-by-four box, and so on. The boxes on the heatmap that should receive the most focus are typically shaded red. Lesser risks are yellow and those within acceptable tolerance are green.
READ: Risk Management Roles and Responsibilities Checklist
More seemingly advanced methods expand their scales. For example, the asset ordered (ordinal value) may be multiplied by a CVSS score. The highest score in this case would be a 50, as CVSS is on a 10-point scale. This is a fundamental error made by nearly 100% of vendors, frameworks and others. The problem is that ordinal scales are not unit measures. They are of a different sort than, say, money.
A scale of high, medium and low is also an ordinal scale. Does a high X and a low Y equal medium risk? Of course not. Nobody would do that. It’s the same with ordinal math using numbers. A mathematician, scientist or any other measurement expert would never do that. Indeed, they would consider it “worse than doing nothing.”
Another form of heatmap that attempts to solve this problem is proposed by the NIST 800-30 risk management standard [external link to: https://csrc.nist.gov/pubs/sp/800/30/r1/final]. In the appendix, a number of heatmaps are shown. These use fixed probabilities in combination with ordinal scores.
Cyber Risk Quantification
The state-of-the-art in cybersecurity risk management is cyber risk qualification. CRQ is decision analysis applied to cybersecurity risk management. Think of it as bringing practices from economics, actuarial science, decision science and tiny amounts of data science together.
CRQ is picking up steam. For example, the National Association of Corporate Directors recommends CRQ as a best practice directly. The new SEC Cyber Rules emphasize having the board’s process for overseeing cyber risks in place at all levels speaking directly to the need for CRQ.
What Is a Qualitative Cyber-Risk Management Plan?
An ideal plan can still use ordinal scales. You’ll want to avoid the temptation to do any form of arithmetic using those scales. Rather, treat ordinal scales as “buckets” full of counts of things. Those counts are units and, thus, those are where you will want to do the math, rather than the ordinal scales.
You will want to create time-based ratios (rates) with those counts. Your rates can then be applied to different classes for risks. You can even apply these rates directly to the five NIST Cybersecurity Framework (CSF) functions: Identify, Protect, Detect, Respond and Recover. You could have key rates applied to each of these. Those rates become the main ingredients for defining key performance indicators and KPI velocity that form the basis of a plan.
KPI Design in Risk Management
There are three basic rates to consider. For the purposes here, the focus described in detail is the risk removal rate (aka burndowns). The other two basic rates are risk survival and arrival.
Burndown measures the baseline rate of risk removal. This includes vulnerabilities, deprovisioning, malware and all sorts of work items. Assume in January, you found 100 critical vulnerabilities. Think, for example, CVSS score 9-plus on a critical asset. In that same month, 50 of those vulnerabilities were fixed. For January, you have a 50% burndown rate. That rate is not a baseline, though—not yet. Next month, you find 100 more new vulnerabilities. Of the remaining, you fix 30 more. Your cumulative burndown rate is now 80/200 (40%).
As time passes, your baseline will stabilize. You now want to set KPIs against these. Those KPIs should be stated: “The critical vulnerability burndown rate should be 90% or better over the last 90 days.” This method of measurement ties to the development of efficiently performing capabilities. If you only use a single point in time as a measure, you can be fooled into thinking you have an over-efficient or under-efficient capability.
Velocity Qualification
If a KPI (rate) is holding, while the volume of risk is stable and or increasing, you can characterize your capabilities velocity as scaling. If the rate is increasing (getting better), while risk is stable or increasing, you would say your capability is accelerating. Lastly, if your capability rate is decreasing, while the risk is stable, you would qualify your capability as slowing.
A Mature and Measured Risk Plan
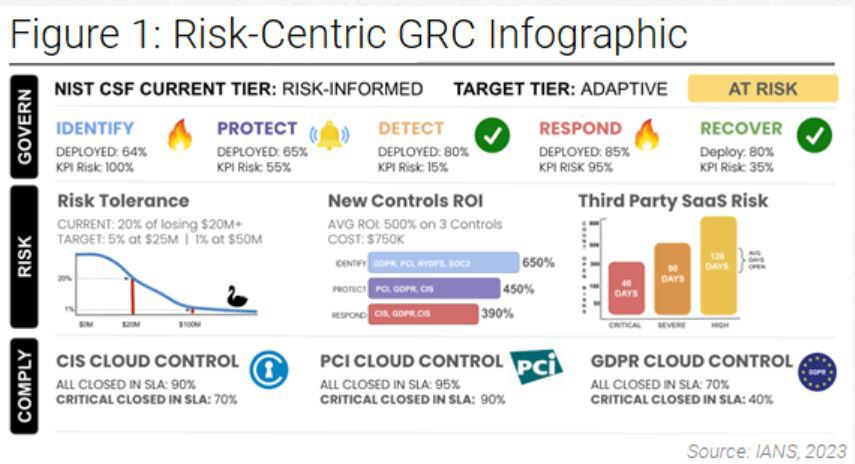
Figure 1 shows a mix of time-based ratios with CRQ measures. Note how the NIST CSF is incorporated. You can start with what is recommended here. Yes, it is qualitative; yet, at the same time, metrics are used that are mathematically unambiguous. The “plan” is to govern risk so it is within your level of tolerance, and so you are not “at risk” but are able to tell if things are heading that way.
Although reasonable efforts will be made to ensure the completeness and accuracy of the information contained in our blog posts, no liability can be accepted by IANS or our Faculty members for the results of any actions taken by individuals or firms in connection with such information, opinions, or advice.