
Reporting Meaningful Security Metrics to Leadership and the Board
There are two main classes of security metrics and two personas that consume metrics. Those classes are deployment-based and risk-based. You can use these two classes of metrics to communicate with the C-suite by mapping your key security capabilities to objects like threats or possibly things like NIST Cybersecurity Framework (CSF) functions. This piece sheds light on each metric and persona and how to get started measuring for each.
Deployment and Risk-Based Security Metrics
There are two classes of metrics: deployment- and risk-based. A great example of deployment metrics is the Center for Internet Security (CIS) Critical Security Controls V7 metrics. There are just shy of 140 different metrics associated with specific controls. Deployment metrics fit into two buckets. The first bucket can be considered configuration-based. Half of the CIS metrics measure if a control is configured correctly or not. That means it’s a yes/no answer. The other type of CIS metric is coverage-based. There are six levels of coverage called sigma levels. For example, the highest sigma level expects control coverage to exceed 99%.
Most organizations focus on deployment metrics to the exclusion of all others. It is a good place to start. Indeed, it is certainly better than doing nothing. The problem is it’s a measure of your deployment capabilities and not a measure of your risk management capabilities. While you do want to be efficient in rolling out your controls, that’s not your mission. Your mission is cyber-risk mitigation. The question is how well you are doing in reducing the likelihood and impact of losses. Are those capabilities you deployed doing their job well or not? Metrics that answer this class of question are risk-based.
Setting Risk-Based Goals for Accurate Metrics
Ultimately, you want to know if your controls are performing their job efficiently. That means you will need to set risk-based goals for your capabilities, aka KPIs. Key performance indicators (KPIs) are the meshing of metrics with risk-based goals. In terms of risk, a KPI will have a dimension for value at risk. The most common proxy for value at risk is an asset. An asset can be something as abstract as a workload to something as large as a whole company, region or business unit. KPIs can also include some form of control-based dimension. Controls can be at a granular level—for example, referencing a specific type of protocol version for encryption. Or the control dimension could be larger, like “vulnerability remediation.” With value at risk and control dimensions in place, you are ready to apply some form of SLA. Most often, the SLA is the achievement of a target rate over time.
The simplest way to form an SLA is to use what measurement experts call a hit-and-miss model. Achieving your SLA is a hit. Not achieving your SLA is a miss. This becomes a simple ratio of achievement over total. Or: hits / (misses + hits).
Below is an example of a monthly hit-and-miss ratio. Again, a hit is meeting the SLA requirement. A miss is when you don't make it. As stated, the ratio is hit over total; total being hits + misses. For example, in month one, there were 100 critical vulnerabilities for internet-facing assets. Notice how all the dimensions previously mentioned are here in terms of value at risk (internet-facing) and controls (vulnerability remediation). Of those 100 vulnerabilities, 98 were remediated within SLA.
Vulnerability remediation KPI: 95% of critical externally facing vulnerabilities are remediated with 30 days over a 90-day period:
- Three-month cumulative score: 95% (334/350)
- Month 1: 98 of 100: 98%
- Month 2: 48 of 50: 96%
- Month 3: 188 of 200: 94%
Notice how we are looking at the performance over time. We are not looking at a single point and time to tell us if our capability is efficient. As a rule of thumb: Ninety days of evidence should be required to assess if a capability is efficient.
This KPI is yellow which follows the policy (or rule) for critical risks. You, of course, can decide on what makes best sense given your risks. The rationale here is that if there is a consistent decrease over three months, even if the metric target was 95%, the metric will be yellow. This is for you to decide, given the value that is risk.
Creating Security Metrics for Business Leaders
There are two classes of security metrics that business leaders care about aggregate operational metrics and financial metrics. The latter involves key risk indicators (KRIs). Short of KRI-based financial measures, you can use the metrics approach detailed above as a means of communicating cybersecurity metrics with leaders. This means mapping your key security capabilities to objects like threats or potentially to objects like the NIST CSF functions.
Threat objects include things like ransomware, business email compromise, vendor risk (SaaS), third-party cloud risk, insider threats and so on. The NIST CSF functions are identify, protect, detect, respond and recover. You want to treat these as “capability buckets.” That means under each “object” you would list the relevant KPIs. For example, vulnerability management would fall under “protect” if you chose to stick with the NIST CSF. You would also have measures associated with malware defense and more in the same bucket. If you have 10 KPIs under protect, you could then aggregate them together. For example, if eight of them meet the target, you would state 80% compliance to your protection goals. That, of course, is just a start.
READ: Create Metrics to Use for Budget and Decision-Making
Note: You can report in on both deployment and risk measures, as have been articulated above. At a very high level, indicating if SLAs for each have been met comprehensively. If so, you could say, "Our ransomware control deployment and risk management goals have been met for this quarter. This includes how we protect users, systems, network and backups." From there, you can share both coverage and risk management metrics for each sub-area as I just articulated (training, email, etc.). Granular details should be put in the appendix of any leadership deck.
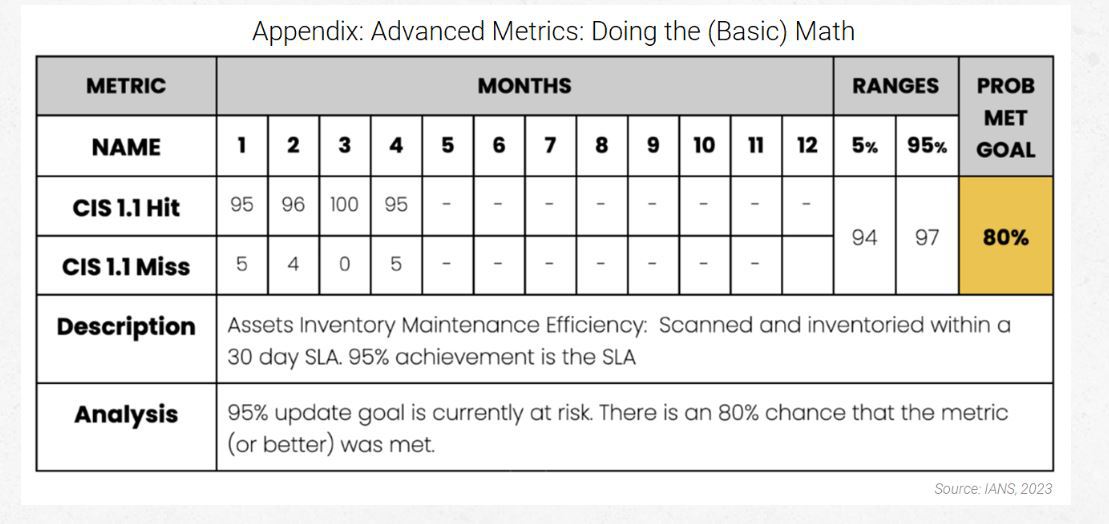
Above is what a full KPI metric for this might look like. Note that you would have a table like this for each of your key capabilities and related controls. Start with all your capabilities associated with critical assets and that already have SLAs defined for them. This section explains the math used to get at the “Probability of Meeting Goal” cell in yellow above.
Assuming you will use Excel for your metrics, for the most basic hit-and-miss metric, you can do the following, noting that “total” is “hits + misses.” The addition of the “1” has to do with the excel formulas you are about to use.
(1 + hits) / (1 + total)
If we look at month two from the last example above, we had 48 hits out of 50 total events. Our equation becomes:
(1 + 48) / (1 + 50) = 96%
This is how you would calculate simple hit-and-miss average metrics.
Now, we are going to upgrade and start using a simple Excel formula that implements the beta distribution. I won’t go into any statistical detail here. Just trust that the beta distribution is the right tool for this job—and see our books if you want to go deeper.
Let’s assume your KPI is 95%. Did you make it? We need to add one to both the hits and misses. Consider one your starting point for the hit and miss values. We then subtract one from the beginning (far left) of the formula to get the inverse results. Without the subtraction at the beginning, we are asking if the claim is false. We want to know if 95% or better was achieved—was it true? Our analysis says our achievement of 95% or better is ~60% true. We don’t have enough data to know for sure. Our rate is still baselining month over month.
This approach to measurement achieves an important, yet often missing, security principle. In measuring security capabilities, we must “retain our uncertainty without obscuring our certainty.” If we went with the 96%, we would have rejected important uncertainty in favor of a false sense of certainty. This is how we got to the ~60% value:
1 - BETA.DIST(target, hits, misses, cumulative = TRUE)
Hits: 334 + 1 = 335
Misses: 16 + 1 = 17
1-BETA.DIST(95%, 335, 17, TRUE) = 59%
We can improve on this even further. Let’s get our 90% credible interval. We want to know with 90% credibility where the true rate may live. To do that, we need to get the lower and upper bound values for where the rate may live. It looks like this:
BETA.INV(5%, 335, 17) = 93%
BETA.INV(95%, 335, 17) = 97%
What did we find out? That there is a 90% chance the true rate is between 93% and 97%. You could be conservative and state that you have not achieved your KPI unless the lower bound is at or above your KPI number. That means instead of 93% you would want to see 95%. That would still leave a small chance that your true rate is outside your credible range with a 5% probability.
Although reasonable efforts will be made to ensure the completeness and accuracy of the information contained in our blog posts, no liability can be accepted by IANS or our Faculty members for the results of any actions taken by individuals or firms in connection with such information, opinions, or advice.